School Web Map • Table of School Webs • Student Performance • Current Spending • National Data • Taxation • Bingo
School Web Map
This interactive map shows the sending and receiving patterns that students have followed historically in Vermont as they make their way from preschool through high school graduation. Schools are shown as dots, which when clicked provide more information. The lines between the dots show the paths most students take on their PreK – 12 educational career. Please let us know how this map might be improved.
Where Students Live
This map shows how the population of Vermont is distributed. Any re-design of school organization must begin with where students actually live today. Notice that these settlement patterns follow the dictates of the mountains and rivers of our geography, and have little or no relationship to town or school-district lines. Notice also that the locations of our school webs above follow very closely to these organic settlement patterns.
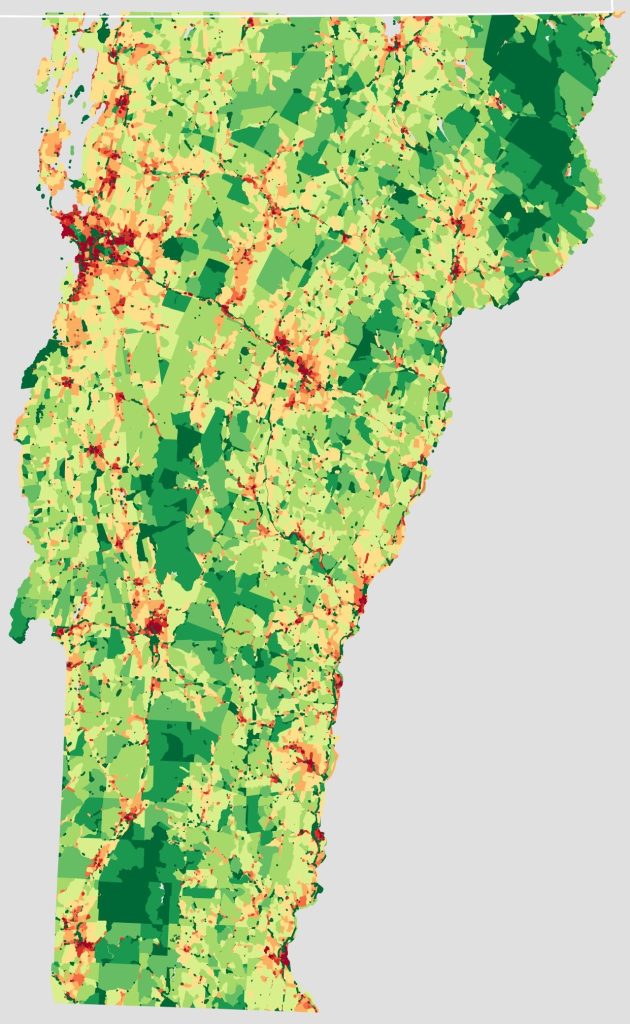
Table of School Webs
This table lists the K-12 School Webs that are shown on the interactive map above. The webs are based on our existing organic K-12 patterns of sending and receiving schools. We have formed ourselves over the years into 50 such webs, each centered around a high school, with several feeder elementary and middle schools. Our webs range in size from 522 in Thetford to 4300 in Champlain Valley. Some encompass two schools; some include as many as ten. In some urban webs the distances between schools are less than a mile; in the most spread out web it’s 114 miles.
Map of Vermont School Districts from Vermont GIS
Student Performance
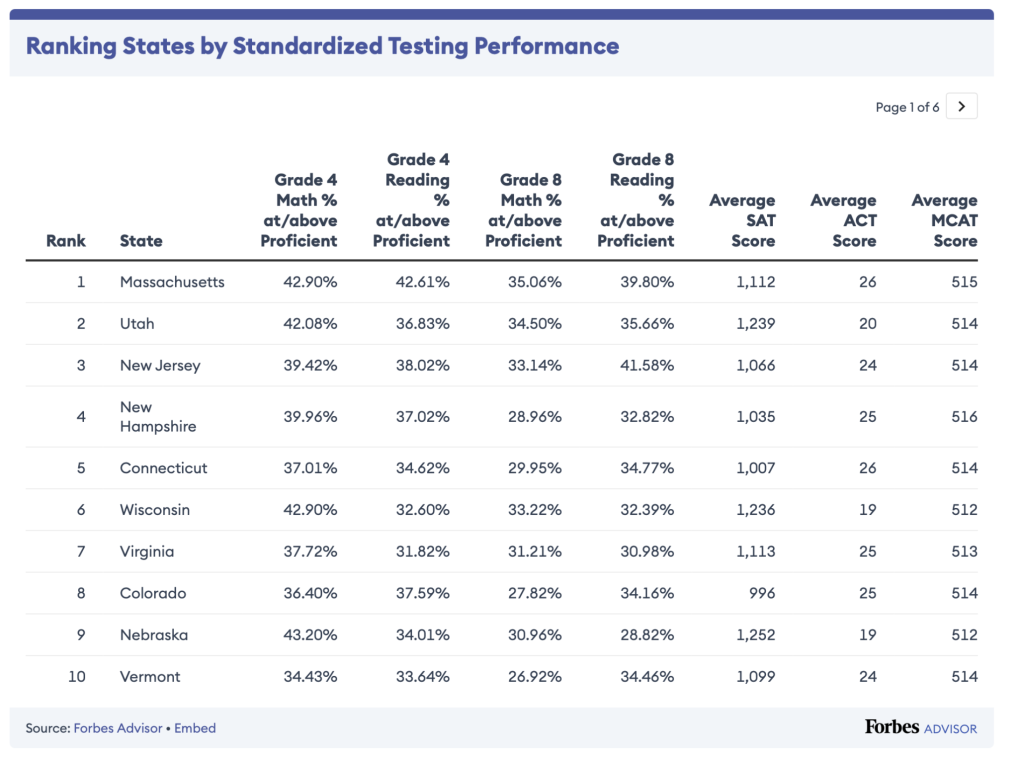
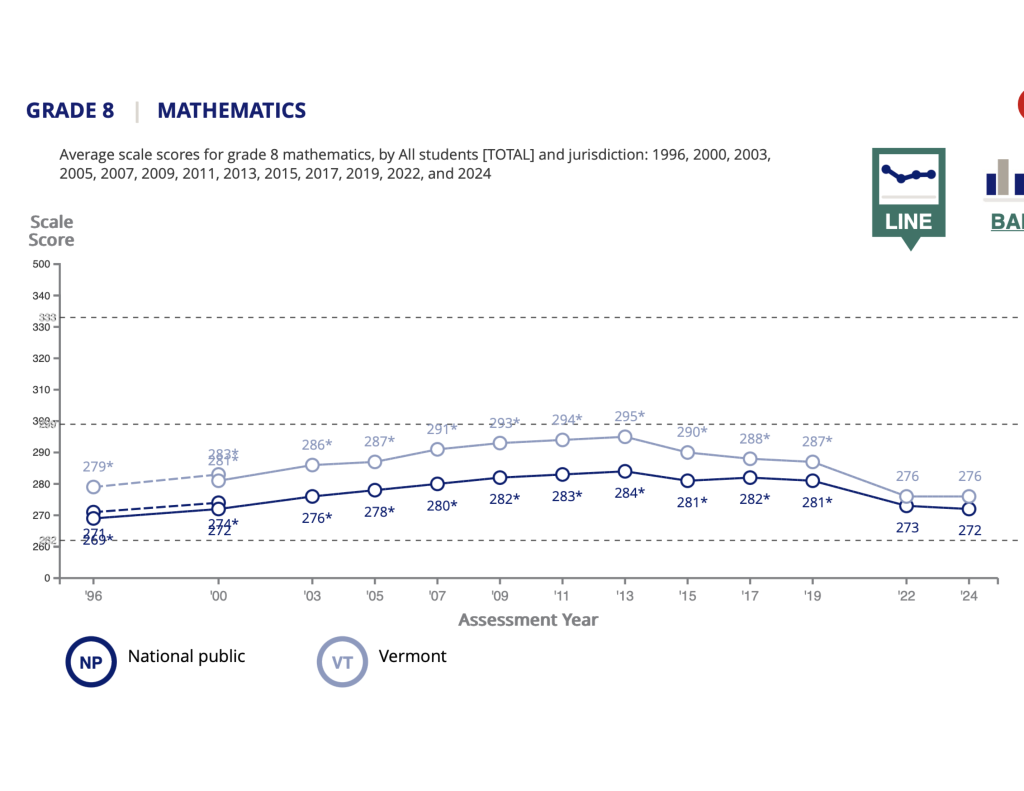
Vermont’s system of small schools with small classes under community control has allowed our students to outpace the nation for the last 40 years. Forbes magazine ranks Vermont in the top ten for student test scores in 2024.
The World Population Review for 2025 ranks Vermont’s schools in the top five of states.
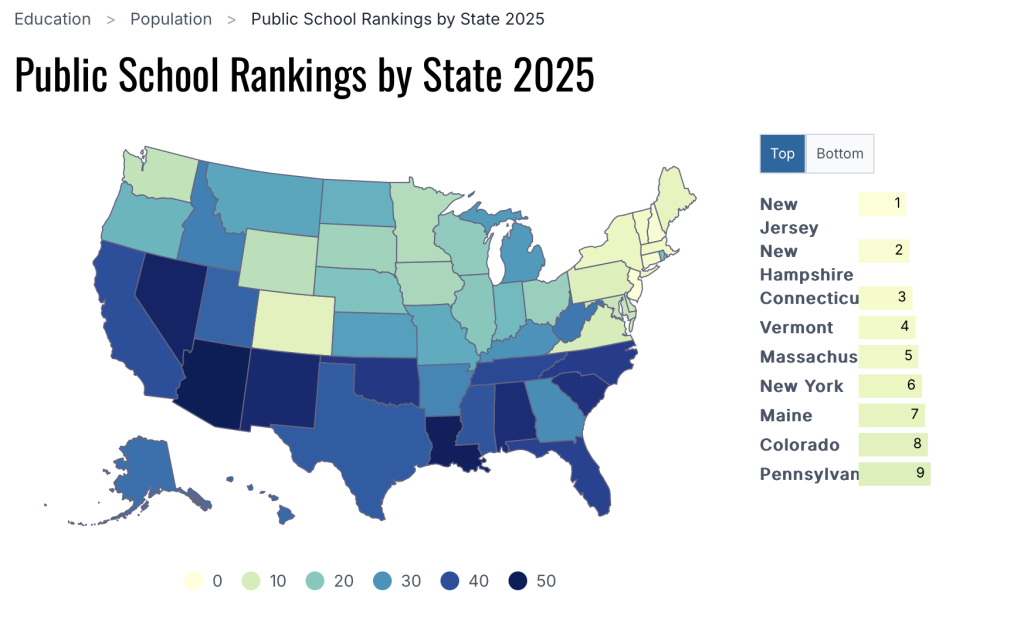
Metrics included high school graduation rate among low-income students, math and reading scores, median SAT and ACT scores, pupil-teach ratio, the share of armed students, the number of school shootings between 2000 and June 2020, bullying incidence rate, and more.
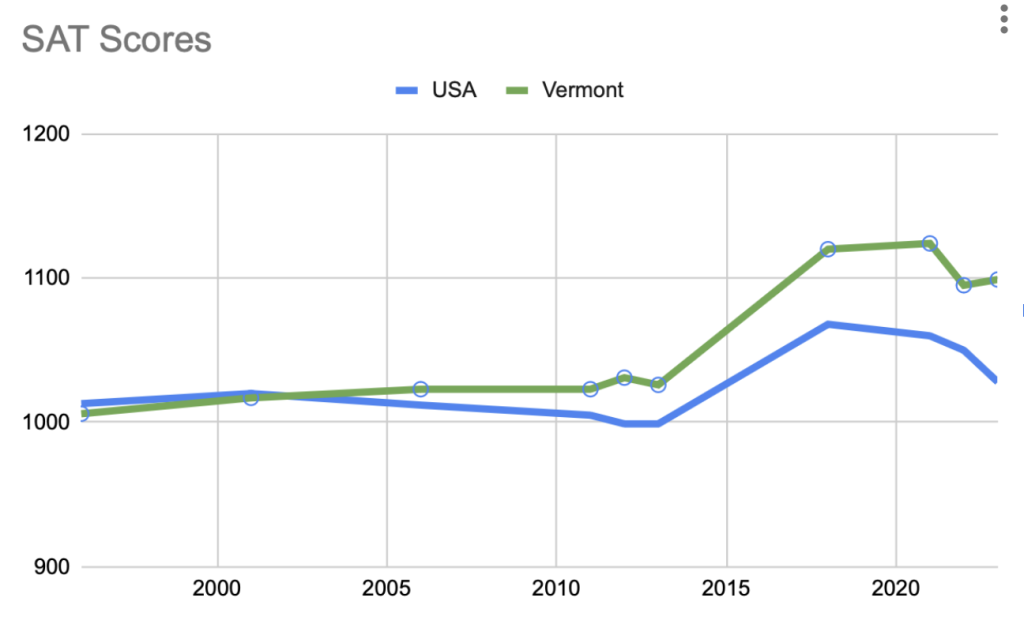
Vermont has for the last 20 years ranked exceeded the national average in SAT scores.

Vermont students, with their small classes in small schools under community control, persistently scored above the rest of the nation on the National Assessment of Educational Progress. Only in 2017, when Governor Scott took office, did this achievement gap begin to diminish.
Current Spending
The vast majority of Vermont school districts today spend between $17,000 and $22,000 per student, with an average of $20,000. Spending is not significantly correlated with district size.
| District Name | Spending per Student | Students |
| Morgan | 14,616.50 | 40 |
| Mt. Anthony UHSD #14 | 15,068.48 | 1678 |
| Pittsfield | 15,791.74 | 53 |
| Stamford | 15,905.71 | 106 |
| Somerset | 15,962.44 | 2 |
| Derby | 16,314.93 | 340 |
| Holland | 16,414.73 | 54 |
| Granville-Hancock USD 80 | 16,730.12 | 93 |
| Westfield | 17,354.25 | 36 |
| Fairfax | 17,679.30 | 884 |
| Georgia | 17,769.31 | 856 |
| Northern Mountain Valley UUSD | 17,781.97 | 1068 |
| Quarry Valley UUSD 70 | 17,790.24 | 1013 |
| Colchester | 17,932.20 | 2284 |
| Barre UUSD | 17,977.73 | 2205 |
| Lamoille North MUSD U058B | 18,017.30 | 857 |
| Slate Valley UUSD | 18,103.06 | 1286 |
| Enosburgh-Richford UUSD | 18,159.38 | 922 |
| Echo Valley Community SD 67 | 18,220.20 | 293 |
| Rutland Town | 18,244.41 | 526 |
| Paine Mountain SD 68 | 18,245.03 | 1025 |
| Fletcher | 18,352.01 | 204 |
| Ferdinand | 18,396.17 | 3 |
| Ira | 18,399.74 | 43 |
| North Bennington ID | 18,515.21 | 161 |
| Rockingham | 18,580.87 | 458 |
| Waits River Valley USD U036 | 18,617.05 | 357 |
| Otter Valley USD 53 | 18,622.99 | 1259 |
| Mt. Mansfield UUSD | 18,633.62 | 2484 |
| Stannard | 18,654.37 | 15 |
| Brighton | 18,659.86 | 127 |
| Barstow USD 49 | 18,680.88 | 290 |
| Lake Region Union Elem-Middle SD | 18,764.98 | 734 |
| Lake Region UHSD #24 | 18,797.00 | 382 |
| Elmore Morristown UUSD | 18,847.37 | 791 |
| Halifax | 18,978.89 | 100 |
| St. Johnsbury | 19,012.71 | 1101 |
| North Country Sr UHSD #22 | 19,062.53 | 757 |
| Winhall | 19,146.24 | 229 |
| Missisquoi Valley SD | 19,148.80 | 1775 |
| Southwest Vermont UESD | 19,234.95 | 1233 |
| First Branch USD 82 | 19,320.38 | 363 |
| Buels Gore | 19,334.62 | 4 |
| South Burlington | 19,372.88 | 2561 |
| Troy | 19,427.72 | 182 |
| Kingdom East UUSD | 19,494.74 | 1821 |
| Bellows Falls UHSD #27 | 19,666.00 | 385 |
| Montpelier-Roxbury UUSD 71 | 19,670.59 | 1221 |
| Windham | 19,713.12 | 19 |
| Readsboro | 19,759.29 | 68 |
| Milton | 19,763.88 | 1498 |
| Charleston | 19,851.56 | 114 |
| Sharon | 19,882.17 | 281 |
| Champlain Valley USD 56 | 20,095.44 | 4052 |
| Essex-Westford EC USD 51 | 20,140.72 | 3656 |
| Rutland City | 20,171.72 | 1917 |
| Arlington | 20,181.40 | 358 |
| Stowe | 20,187.25 | 745 |
| Stratton | 20,198.86 | 59 |
| Mt. Ascutney SD | 20,229.08 | 597 |
| Cambridge | 20,261.68 | 290 |
| Wolcott | 20,291.82 | 255 |
| Rochester- Stockbridge 81 | 20,345.92 | 181 |
| Strafford | 20,455.88 | 170 |
| Mettawee SD 84 | 20,484.99 | 301 |
| North Country Jr UHSD #22 | 20,487.77 | 263 |
| Sandgate | 20,510.09 | 63 |
| White River USD 79 | 20,598.83 | 566 |
| Oxbow UUSD | 20,606.18 | 655 |
| Wells Spring UUSD 69 | 20,658.09 | 266 |
| Green Mountain USD | 20,742.90 | 668 |
| Weathersfield | 20,813.40 | 355 |
| Cabot | 20,852.44 | 164 |
| Taconic & Green Regional SD 63 | 20,859.34 | 1662 |
| Lowell | 20,866.37 | 85 |
| Champlain Islands UUSD | 20,997.26 | 407 |
| Newport Town | 21,013.66 | 144 |
| Maple Run USD 57 | 21,042.10 | 2427 |
| Mill River USD 52 | 21,077.02 | 718 |
| Hazen UHSD #26 | 21,101.37 | 323 |
| Hartford | 21,236.58 | 1312 |
| Danville | 21,240.77 | 311 |
| Blue Mountain Union U021 | 21,310.58 | 385 |
| Burlington | 21,325.14 | 3703 |
| Mountain View UESD | 21,390.29 | 320 |
| Canaan | 21,447.68 | 147 |
| Alburgh | 21,487.38 | 313 |
| South Hero | 21,500.40 | 196 |
| Orange Southwest USD 59 | 21,523.53 | 858 |
| Athens Grafton SD | 21,538.93 | 73 |
| Addison Central USD 55 | 21,733.42 | 1702 |
| Springfield | 21,825.81 | 1247 |
| Vernon | 21,834.52 | 320 |
| Westminster | 21,910.78 | 221 |
| Lincoln SD | 22,172.88 | 188 |
| Ludlow-Mt. Holly UUSD | 22,204.46 | 328 |
| Coventry | 22,233.81 | 176 |
| Harwood USD | 22,388.42 | 1720 |
| Twinfield USD U033 | 22,590.06 | 330 |
| River Valleys USD | 22,626.45 | 268 |
| Peacham | 22,797.18 | 97 |
| Caledonia Cooperative SD 78 | 22,841.45 | 574 |
| Hartland | 22,841.81 | 419 |
| Craftsbury | 22,887.48 | 159 |
| Norwich | 22,957.65 | 595 |
| Newport City | 23,006.56 | 302 |
| Washington Central UUSD | 23,022.06 | 1377 |
| Thetford | 23,064.97 | 402 |
| Winooski ID | 23,089.61 | 898 |
| Northeast Kingdom Choice SD 65 | 23,143.65 | 297 |
| Mt Abraham USD 61 | 23,150.99 | 1226 |
| Lamoille North MUSD U058A | 23,309.23 | 586 |
| Windham Southeast SD | 23,445.45 | 2204 |
| Windsor Central UUSD 76 | 23,509.31 | 918 |
| Twin Valley USD 75 | 23,790.52 | 376 |
| Addison Northwest USD 54 | 23,798.73 | 907 |
| West River MUED 72B | 25,810.68 | 247 |
| Jay | 26,734.85 | 41 |
| West River MUED 72A | 27,106.76 | 233 |
| Marlboro | 27,809.39 | 133 |
| Rivendell Interstate School District | 28,775.89 | 296 |
| Searsburg | 29,000.11 | 18 |
| Total | 84415 | |
| Mean | 20,468.28 | 698 |
| Median | 20,276.75 | 355.94 |
| Correlation | (0.07) | |
Source: FY2024 Education Budget per Equalized Pupil as published by AOE at https://education.vermont.gov/sites/aoe/files/documents/edu-FY24-Cohort-Spending-by-School-Type-v02-web.xlsx
National data
Public School Rankings by State, compiled by the World Population Institute, and based on a variety of measurements, put Vermont fourth in the nation in terms of school quality.
School District Size by State
Spending vs. Quality
School spending and school quality in the United States are highly correlated. The more you spend per student, the higher the quality of your schools. The correlation is strong, at 0.71.
Taxation
Much of Vermont’s inequality in schooling and tax rates stems from the vast differences in taxable wealth per student among our towns. We have wrestled for 50 years with this problem, hoping to remedy it with tweaks to the education aid formula, none of which have worked. And the inequality is only getting worse. This table shows the taxable property per student in our towns. It ranges from $527,000 to $25,000,000.
Stories
The Three Little Vermonters
…and the Big Bad Tax Man
Once upon a time, there lived three average Vermonters, neighbors in the same town. They were very much alike. Each lived in a home of about 1700 square feet on a small plot of land and enjoyed an income of about $60,000 per year.
One was a teacher. One was a landlord. The third lived off his investments. They loved living in the Green Mountain State.
One day the Big Bad Taxman came along. He knocked on the door of the first house.
“Little teacher, little teacher, let me in!”
(He was correcting papers with a pencil and pen.)
“I see that your income is about 60K.”
“That’s right Mr. Taxman, it’s on public display.”
“So first six percent for Social Security,
Then another for Medicare, to support your maturity.”
“That seems like a lot — four thousand at least,
And by the time I can use it, it might not exist!”
“Let’s move on to income: for the Feds twelve percent,
Then five more for the State – all money well-spent.”
“Twenty-four percent, it looks like you’re taking;
This makes me sad, it’s my bank you are breaking!”
“But that’s not all: there’s your Property Tax:
For your house and land, we’ll need 5K in my sack.”
“Twenty-one thousand! You’ve got to be joking;
I’m not a rich man; my finances are choking!.”
“And don’t forget sales tax: a full six percent
And nine for your meals, that you can’t circumvent.
For you that’s another two thousand dollars…”
“Please stop! I give up! I just want to holler!
Of my income you’ve grabbed thirty-eight percent.
It doesn’t seem fair, though I see where it went.”
Next day the Big Bad Taxman knocked on the door of the second house.
“Little landlord, little landlord, let me in!”
(He was counting his rent receipts money within.)
Cash and checks piled up on the table
The Taxman would have seen 80K if he were able.
“How much is your income?” asked Taxman at first;
“That’s none of your business,” was Landlord’s outburst,
“I’ll file my taxes with the feds when I must,
“And whatever my figures, you’ll just have to trust.”
“With deductions and credits and depreciation,
Six thousand and three’s the net taxable notation.”
“Well, none of that’s wages so no contribution
To Medicare, Social, or redistribution.”
“Now as to your income…”
“My fed AGI
Is practically zero; my accountant is wise:
She makes sure that number is so very small
That to the Feds I pay almost nothing at all.”
“So half of that, Vermont gets three-sixty.
Please pay that in April, and don’t be too tricky.
Now property tax: how much is it worth?
Your house with four apartments, sitting here on the earth?”
“It’s considered as rentals, so its tax assessment
Is based not on its value, but return on investment.
They take the net profit, and multiply by twenty;
On that basis: a hundred thousand is plenty.”
“Okay then, please give me seventeen hundred;
I hope that’s not too much, that you don’t feel plundered.”
“Now finally your sales tax: two thousand will do;
Your total: four thousand, and three sixty-two.”
“Goodbye, Mr Taxman, I’m pleased to oblige
With a small contribution to keep government alive.”
Over to the third house, the retired investor. The Big Bad Tax Man knocks at the door.
“Little investor, little investor, let me in!”
(Checking his stocks, his bonds, on his screen.)
(Year-to-date growth shows positive gains,
Equal to forty thousand and change.)
“Let’s see what you’ve got there, these tidy investments;
How much are they worth? What’s the assessment?”
“That’s none of your business, you lowly civilian;
Suffice it to say, it’s more than a million.”
“I can’t tax you on that, it’s fully exempted;
Nor state nor federal, though we be tempted
To ask to you pay a fair share of that money.
(With all that you have it does seem kind of funny.)
How about your income? Let’s see your ten-forty.”
“Not much to report there, nothing too sporty:
Our social security’s taxed but in half;
Subtract from that deductions on my behalf,
And you’ll see that my taxable income is slight:
For Feds and the State my tax burden is light.”
“None of it’s wages, so there’s no benefaction
To Social Security, not any subtraction.”
“For income you owe me five thousand and three;
Let’s talk now of tax on your nice property.
It’s valued at 300K like your neighbor’s
So I’ll need five thousand, that’s this year’s flavor.”
“From that five thousand, to be fair to me,
A homestead break of two thousand and three.
I’m old, and my income is under the limit;
I owe you three thousand, and that’s what I’m giving.”
“Now sales tax is easy, same as your neighbors:
About two thousand, and I’m doing you a favor.
Your net contribution to the commonweal
Adds up to ten thousand: how does that feel?”
At the end of the day, the Big Bad Tax man carries $38,281 in his sack:
• $22,700 from the teacher;
• $ 5,081 from the landlord; and
• $10,500 from the investor.
• Does this seem fair to you?
Analysis
Let’s see how the taxman’s takings fit with the balance sheet of property and income of our three.
| Teacher | Landlord | Investor | Total | ||
| Property Value | |||||
| Property, house | $300,000 | $300,000 | $300,000 | $900,000 | |
| Property, other | $0 | $0 | $1,000,000 | $1,000,000 | |
| Property total | $300,000 | $300,000 | $1,300,000 | $1,900,000 | |
| Income | |||||
| Income, wages | $60,000 | $60,000 | |||
| Income, capital growth | $40,000 | $40,000 | |||
| Income, rents | $60,000 | $60,000 | |||
| Income, Social Security | $60,000 | $60,000 | |||
| Income total | $60,000 | $60,000 | $100,000 | $220,000 | |
| 1040 AGI income | $60,000 | $6,003 | $30,000 | $96,003 | |
| Taxes | |||||
| Vermont Property tax | $5,100 | $2,000 | $5,100 | $12,200 | 1.7% of value |
| Rebate | $0 | $0 | $2,000 | $2,000 | |
| Net property tax | $5,100 | $2,000 | $3,100 | $10,200 | |
| Federal income tax | $7,200 | $720 | $3,600 | $11,520 | 12% of AGI |
| Social Security tax | $4,800 | $0 | $0 | $4,800 | 8% of wages |
| Total Federal tax | $12,000 | $720 | $3,600 | $16,320 | |
| Vermont income tax | $3,600 | $360 | $1,800 | $5,760 | 50% of Federal |
| Vermont sales tax | $2,000 | $2,000 | $2,000 | $6,000 | $2000 per family |
| Total Vermont tax | $10,700 | $4,360 | $6,900 | $21,960 | |
| Total Taxes | $22,700 | $5,081 | $10,500 | $38,281 |
From our Three little Vermonters, the State and Federal governments collect about $38,000 per year, most of it from the teacher. (A similar burden would apply to an office worker, a small business owner, a firefighter, a carpenter, a technician, a cook, anyone who earns their income in wages.) That’s a heavy tax burden, heavier even than in the progressive countries of northern Europe.
It’s no wonder these middle-class families — the kind we need to strengthen Vermont’s economy and society — find our state unaffordable and its tax burden inequitable. And it’s no wonder that we see a growing influx well-to-do retired folks and real estate speculators moving into our Green Mountain State: they enjoy significant tax advantages.
Between them the three own $1.9 million of property, and receive an income of $200,000. Yet Vermont collects only $10,000 from that property each year (most of it from the teacher), an overall rate of one-half of one percent. And from their income it collects $5760 (again, most of it from the teacher), an overall rate of about 3%. The effective Vermont tax rates for our three are:
| Property tax rate | Income tax rate | |
| Teacher | 1.7% | 6.0% |
| Landlord | 0.6% | 0.6% |
| Investor | 0.2% | 0.2% |
Perhaps Vermont is overtaxing some of its citizens, and undertaxing others.
We need a simpler and fairer way to collect the funds that Vermont needs to operate its schools and highways and other necessary functions of government. A proposal that would reduce the tax burden for most Vermonters.
VEBS Bingo
 |
VEBS Bingo |
|
How to Play: Next time you are sitting at a board meeting, legislative hearing, or presentation on Vermont education, listen for the words above, and click when you hear one. First person to get bingo wins. Click here to suggest additional words. Copyright © James G Lengel 2010 |
||||
Click here for a stand-alone version of VEBS Bingo.
2 responses to “Resources”
-
Thanks for all of this information and data. I am sure you have not shared any of this with the legislators and governor (kidding I hope) I am a retired principal and was a principal in 6 small and one larger elementary schools in Vermont. I have experienced quite a range of quality of education within these experiences . Be happy to share with you those experiences if you like.
-
Thanks, Don, for your comment on A Vermont Design.
With regard to your question, “I am sure you have not shared any of this with the legislators and governor (kidding I hope), “ I can tell you that yesterday I visited the State House and walked into the Senate and House education committee rooms to introduce myself and offer my help as they work toward an education plan. I also sent them emails with a link to the A Vermont Design web site.
Feel free to spread the word that many of us are working on a reorganization plan, hand-crafted in Vermont, that preserves what’s best about our schools while providing communities a clear path toward improving them.

Leave a Reply