Category: News

  • K-12 Boards and BOCES

    We read with interest that citizens in North Country, Rutland, the Capital area, Barre, the Mad River Valley, and Windsor county have taken it upon themselves to discuss various forms of redistricting and sharing of administrative services. They anticipate, perhaps, that change is coming, and they want to get out in front of it. Their conversations include several topics that may be important for the improvement of public education in Vermont:

    Educational Entities
    They realize that the number of overlapping educational entities in their area: Towns, Villages, School Boards, Supervisory Unions, Supervisory Districts, and CTE Centers, may be not necessary and might be ripe for reduction.

    K-12 community cohesion
    No matter what happens at the state level, they want to preserve the K-12 curriculum cohesion and democratic community control that they have worked so hard to nourish.

    Shared services
    They realize that some services such as transportation, special education, accounting, purchasing, payroll, technical education, insurance, and health services are more efficiently handled not by each district alone, by some kind of cooperative arrangement among them, such as Boards of Cooperative Educational Services (BOCES).

    Focus on students
    They want to be sure that whatever is done focuses first on the improvement of a student’s educational journey, and isn’t distracted by all the talk of tax policy, consolidation, private school tuitions, and state control.

    State officials involved in the current committees and task forces surrounding educational reform might be wise to keep an ear to the ground and take cognizance of these grass-roots discussions.

  • Impossible Task?

    Here is the charge to the Redistricting Task Force from Act 73. Is it humanly possible to concoct a plan that meets all these criteria?

    Three options
    In consultation with the Commission on the Future of Public Education, the Task Force shall study and consider different configurations for school district consolidation and propose not more than three options for new school district boundaries.

    Restrictions

    At least one boundary proposal recommendation shall consider the use of supervisory unions and supervisory districts, allow for the continuation of a tuitioning system that provides continued access to independent schools that have served geographic areas that do not operate public schools for the grades served by the independent schools, and to the extent practical, not separate geographic areas that contain nonoperating school districts as such districts exist on July 1, 2025.

    Proposed new school districts or supervisory unions and supervisory
    districts shall:

    •   have, to the extent practical, an average daily membership of not fewer than approximately 4,000 and not more than 8,000 prekindergarten through grade 12 students.
    •   be, to the greatest extent possible, grand list and pupil-count balanced, demographically equitable, logistically feasible, and create the least amount of disruption to students as possible.

    In creating the proposed districts, the Task Force shall consider the following:

    •   current school district and town boundaries and other historic and current community connections, including access to regional services for students, such as designated agencies;
    •   geographic barriers, including mountains and rivers;
    •   population distribution;
    •   location, capacity, and the facility condition index score of current school buildings;transportation and employment patterns and practices;
    •   grand list values accounting for the homestead exemption and current education spending;
    •   student demographics;
    •   the debt, liabilities, and assets of current school districts;
    •   staffing levels and salary scales;
    •   opportunities to support local elementary schools, central middle schools, and regional high schools, with the least disruption to students;
    •   access to career and technical education (CTE) for all eligible students;
    •   the maximization of cost efficiencies;
    •   the location of schools and CTE centers; and
    •   any other factors the Task Force deems relevant.

    It is perhaps interesting that no mention is made of improving the quality of education for students.

  • Redistricting Task Force Meeting Summary

    The Redistricting Task Force created by Act 73 met in Waterbury on the morning of August 1. Here is a summary of the meeting.

    08:30 Elected Sen. Martine Gulick and Rep. Edye Graning as co-chairs.
    Members introduced themselves.

    08:45 Legislative Counsel reviewed Act 73 and the charge of the task force.

    09:10 Members articulated their goals:

    What problem are we trying to solve?

    • Judge David Wolk: Aim at creating better education for students regardless of zip code.
    • Sen. Scott Beck: Governance and excellence that makes sense and offers options.
    • Jay Badams: Consider declining enrollment and increasing costs.
    • Rep. Beth Quinby: Reduce upheaval and chaos in education policy
    • Chris Locarno: Preserve local schools.
    • Sen. Harrison: Keep local schools; coordinate better with CTE; don’t hurt what’s working well.
    • Sen. Gulick: Equitable services to all .
    • Rep Graning: Make data-driven decisions.
    • Judge Wolk: Identify the drivers of high costs.
    • Kim Gleason: Focus on the journey of a student Pre-K 12, align schools to that journey.
    • Jen Botzojorns : Gather local information.
    • Rep.Holcomb: Design something practical and achievable? Not more unimplementable ideas.

    What do we hope to achieve?
    – Create three maps.
    – Identify cost drivers.
    – Identify best practices. Build on what we are doing well.
    – Identify success from collective action among districts.
    – Design cohesive PreK-12 experiences for students.
    – How will we define success? Low taxes? Educational opportunity? Outcomes?
    – Avoid going beyond our mission. Focus on our assigned tasks.
    – Put together maps that are practical and passable.
    – Does consolidation save money?
    – Our task will require some hard choices and sacrifices, and so we must involve the public.
    – Our task will require perhaps more time than has been allocated.
    – Identify what legislation will need to be changed.

    What data do we need?
    – Vermont demographic trends for future student population. And where.
    – How many school districts is enough?
    – We want maps with overlays. Where kids live, and where they go to school.
    – We need access to all the existing data on school buildings.
    – Data on the capacity of the Agency of Education, and what support will be needed in the future.
    – Projections of optimized school locations.
    – CTE sending patterns. List of approved private schools.
    – Teacher and principal turnover data.
    – Clarity on educational outcomes: how do we measure benefit to students?
    – What is an adequate number of educational entities?
    – Data on BOCES-type shared services.

    09:51 Secretary Saunders explains process of filling AOE positions.

    09:55 Discussion of Task Force’s connection with the Commission on the Future of Education.
    What questions should they be asking the public?
    – What is important to preserve in our schools?
    – What are their hopes for the future?
    – School boards want to tell us what they think — we should create a – communication channel(s).
    – What do you value in our current system? (Not structures but values.)
    – What specific aspects of local control are most important to you?

    General comments
    – We need to summarize our work without jargon, so we are transparent.
    – We now have an official Task Force email: ADM.Redistricting@vermont.gov
    – And a website: https://aoa.vermont.gov/school-district-redistricting-task-force
    – We are acting for the entire state, not just our town or school.

    10:05 Break

    Hiring a Facilitator
    10:12 Secretary of Administration Clark explains process of hiring a facilitator(s).
    10:21 Task force suggests a simplified bid process. Authorizes chairs to work with Secretary Clark to develop a bid.
    Discusses scope of work for facilitator:
    – Summaries of meetings.
    – Plans outreach.
    – Writes the final report.
    – Develops a work plan and calendar, working backward from the final report.
    – Gets materials to members well in advance.
    Make sure the facilitator has extensive experience in Vermont public education.

    Data Tools
    10:30 Sec of Digital services Hughes and GIS chief John Allen introduce “District Builder” data tool.
    10:41 Discussion of the data tools.

    Future meetings
    10:43 Discussion of future meetings.
    Agree on sIx-hour meetings, starting at 09:30, In different locations. Will coordinate calendars.

    Public comments

    • Sue Ceglowski, VSBA exec. Commit to fairness, equity, transparency, public involvement. Recognize your flexibility. Preserve community engagement. Don’t add disruption.
    • Cheryl Charles, Westminster school board, and Rural School Alliance. Supports supervisory unions and preservation of rural schools.
    • April Palmer, South Hero parent, advocates not closing schools.
    • Jen Lyon-Horne, parent and school counselor, South Hero, questions the speed of this process.
    • Shantee Parchment, parent in South Hero, promotes safety.
    • Rachel Sweeney, South Burlington, advocates smaller classes.
    • Dylan Degree, South Hero, advocates keeping small schools open.
    • Julie Mach, Pawlet, consider cost analysis of SU vs. SD, advocates tuitioning.

    11:04 adjourn

  • Education Reform, Where Are You?

    I have just finished reading the 154-page education reform bill as it emerged from the conference committee on Friday afternoon. In style, it combines the stream-of-consciousness of James Joyce with the non-sequiturs of Lewis Carroll. But not as much fun to read. It doesn’t do much to improve education. Instead it:

    • sets up eight boards and commissions and task forces, 
    • sets minimum class sizes, 
    • proposes we reduce spending to $15,000 per student,
    • calls for districts of 4000 to 8000 students each,
    • expands the privileges of private schools,
    • encourages over-identification of special ed students, 
    • spends over $4 million to administer its implementation.

    Eight new boards and commissions

    The bill creates a plethora of boards, commissions, task forces, advisory groups, working groups, and steering groups, with overlapping tasks.

    Commission on the Future of Public Education in Vermont

    “There is hereby created the Commission on the Future of Public Education in Vermont…The Commission shall cease to exist on December 31, 2025.” Now this commission already exists, yet it is re-created in this bill, reduced in scope, and given another six months to live. During its short lifetime, it was denied information and support from the Agency of Education, ignored by the Governor, and frustrated by the politicization of its mission. Why are we creating it again?

    Commission Steering group

    On or before July 1, 2024, the Speaker of the House shall appoint two members of the Commission, the Committee on Committees shall appoint two members of the Commission, and the Governor shall appoint two members of the Commission to serve as members of a steering group.” The bill calls for something to happen in the past, for a commission that seems no longer serve any purpose. Why is this in the bill?

    School District Redistricting Task Force

    There is created the School District Redistricting Task Force to recommend new school district boundaries and configurations to the General Assembly…On or before December 1, 2025, the Task Force shall submit a written report …The Task Force shall cease to exist on June 30, 2026.”  How does this task force not duplicate the work of the Commission mentioned above?  $120,000 is allocated to support their work.

    School District Voting Ward Working Group  

    There is created the School District Voting Ward Working Group to create voting district wards within the new school districts…The Task Force shall cease to exist on June 30, 2026.“ So how can we create voting wards within the new districts before we have defined the new districts? How many new entities will this add to our already bloated school governance system?  $215,000 is allocated to support their work.

    The State Board of Education

    The bill re-establishes the already-existing State Board, with new membership and powers, and directs it to “initiate rulemaking to amend the Education Quality Standards.” Standards which do not exist at the moment. $200,000 is allocated for this re-establishment. And how is the work of the Board different from that of the Commission, the Steering Group, the Task Force, the Advisory Committees, the Agency, and the Working Group?

    State Aid for School Construction Advisory Board

    “There is hereby created the State Aid for School Construction Advisory Board, which shall advise the Agency on the implementation of the State Aid for School Construction Program.” School construction aid has not existed for 20 years, but it might be a good idea to allocate some funds for this purpose before setting up yet another board to administer it.

    Education Fund Advisory Committee 

    There is created the Education Fund Advisory Committee to monitor Vermont’s education financing system.” Already the legislative committees on Education, Ways and Means, and Finance; and the Agency of Education; and the Department of Taxes, are charged with this task. Perhaps adding another set of eyes will increase efficiency here.

    Regional Assessment District Stakeholder Working Group

    This has nothing to do with educational assessment, rather it’s a new set of agencies, one in each region, to coordinate listers’ property assessments across the state. It seems like they forgot to appropriate money for this new group. 

    It looks like we’re going to see lots of cooks in the Education Reform kitchen. Including one just to hold the stakes. What are the chances they’ll win a Michelin star?

    Education quality

    The bill mentions the importance of “Education Quality Standards” nine times, but the only specific standard listed is the minimum class size requirement grade by grade. Yet there is no research that suggests larger class sizes increase educational quality. In fact the opposite is true. Is the setting of class sizes best done by the legislature? This important policy has long been the prerogative of local school boards. I can find nothing else in the bill that would increase the quality of our schools.

    Education funding

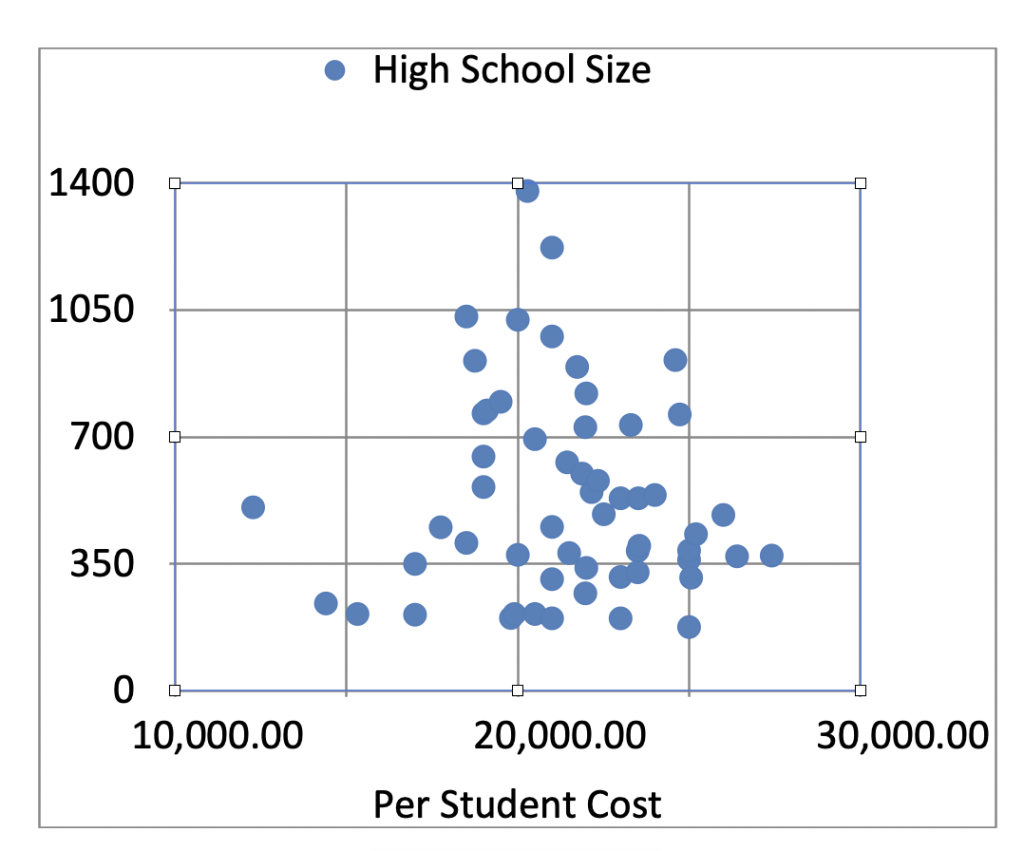
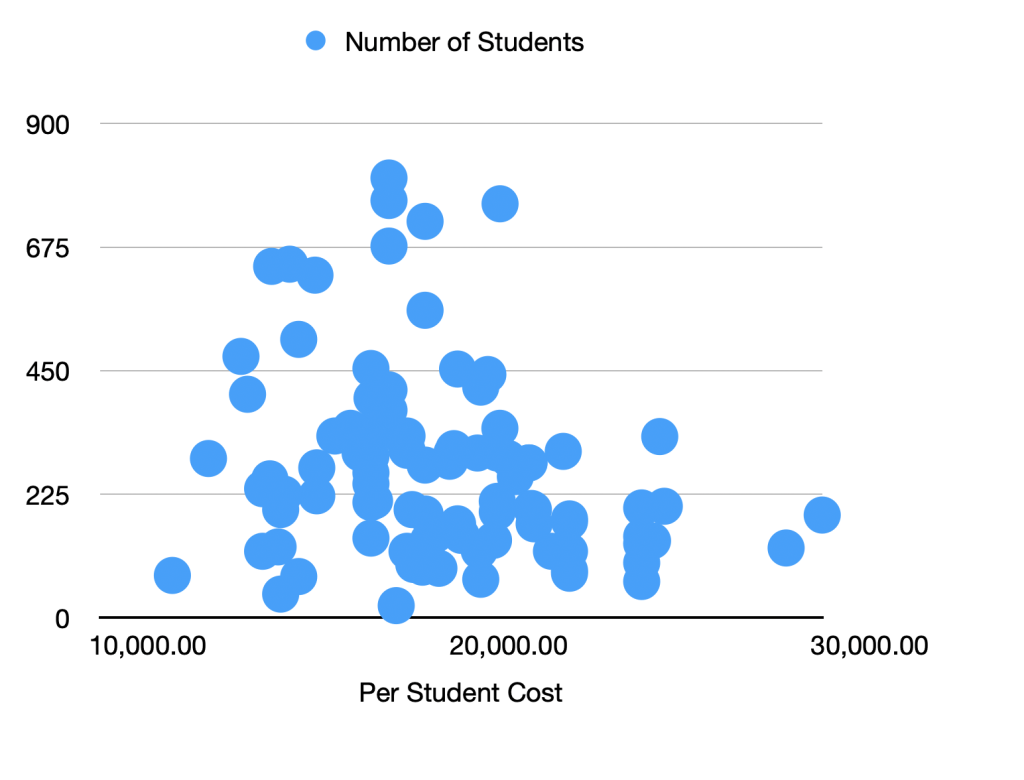
    After a four-year phase in, the bill allows districts to spend up to $15,000 per student, but no more than that. For 99.9% of our students, this represents a considerable reduction from current levels. Today spending averages $20,000 per student. Only one district, Morgan, with 40 students, spends less than $15,000. The bill thus reduces public support for education by 25%. How can this approach improve educational quality? And for those of you interested in evidence-based legislation, know that spending is highly correlated with educational quality.

    Large districts

    The bill mandates districts of 4000 to 8000 students each. None of our districts in Vermont is this big. And the national research says that the highest quality (and lowest costs) are associated with districts of 2000 to 4000 students. A 5000-student district in the Northeast Kingdom, for instance, would stretch from Jay to Canaan to Lyndonville and take 3.5 hours to drive around. There is no evidence, nationally or in Vermont, that larger districts are less costly than smaller ones. To meet this mandate, every existing district in Vermont, even those that produce excellent results at reasonable costs, would need to be dismantled and rebuilt.

    Private schools

    Because the private school lobby spent lots of money at the State House this session, and because two of the six members of the Conference Committee work at private schools, the bill showers them with gifts. It’s bad enough that we currently send $60 million of taxpayer dollars each year in tuition payments to private schools, including religious schools, with no accountability; the reform bill would open the floodgates further. It would allow more taxpayer money to go to more private schools — just about any private school, anywhere, including, in the language of the bill:

    • an approved independent school; 
    • an independent school meeting education quality standards; 
    • a tutorial program approved by the State Board; 
    • an approved education program;  
    • a public school located in another state; 
    • a therapeutic approved independent school located in Vermont or another state or country;

    In addition, it would allow these schools a bonus of $750 per student over what’s provided to public schools. And two of the private schools — St. Johnsbury Academy and Burr & Burton — would be able to charge as much as they wanted in tuition. Which at current levels exceeds the state’s per-student allocation by $10,000. I wonder why these two private schools are singled out for special treatment? See The Academies. See Vermont Ethics Code, section 1203 on conflicts of interest.

    Why are we doing this? How does this strengthen our public schools?

    Special education

    While the bill calls for the development of a strategic plan to overhaul special education — the second largest driver of increased costs — it at the same time incentivizes the over-identification of students. It calls for each student in special ed Category C to get $37,350 per year, and expands the category to include not only blind and deaf students but also anyone on the “autism spectrum.” This offers a clear financial incentive for a district to include as many students as possible in this category. And since the diagnosis of autism is fraught with inconsistencies, we have seen a tripling of identifications in the last decade. In some Vermont districts, almost a third of the students are so identified, far above the national averages. Lead us not into temptation.

    Administrative costs

    The bill proposes a six-year timeline for its implementation, and in the first year calls for an appropriation of over $4 million to pay for the administrative costs of the various boards, commissions, advisory groups, consultants, studies, and clerks.( But no money for school improvement.) Here is the list of expenditures:

    • Adds $2.8 million to AOE budget for 2026 for administrative expenses. Five new positions.
    • Spends  $150,000 for a strategic plan for special ed.
    • Spends $400,000 for consultants to determine the per-student payment.
    • Spends $150,000 for a study of the income sensitivity of the property tax.
    • Spends $200,000 to update the State Board’s rules.
    • Spends $170,000 to support the Redistricting Task Force.

    Taxation

    The bill further complicates the already unpredictable statewide and local property tax system by adding new categories to the homestead exemption and income sensitivity. Why are we setting forth a tax system before we know where the districts will be? And the bill does nothing to expand the tax base so as to focus on ability to pay.

    Conclusion

    This bill will reduce educational quality in Vermont by cutting spending by 25%, adding more task forces and boards to an already confused governance model, increasing class size, and creating large districts that don’t fit Vermont’s communities. It’s also very difficult to read. And expensive.

  • Education Entities

    Many organizations are involved in the operation, governance, and funding of Vermont public schools today. Hundreds of them. We enjoy:

    • 153 school districts, many (but not all of which) operate schools.
    • 50 union school districts that combine towns or districts to operate schools.
    • 53 supervisory unions that provide administrative services to some districts.
    • 251 towns, that collect the property taxes that form the bulk of school funding.
    • 2 interstate school districts.
    • 4 private academies that serve as public schools.
    • 1 Agency of Education
    • 1 State Board of Education
    • 2 Legislative Education Committees

    That’s 517 entities, one for every 162 students. Most of these entities elect a board, and most overlap in their responsibilities. No where else in the world are so many entities needed to provide public education to so few.

    We used to have a lot more. In 1860, we enjoyed 239 towns and 2,591 school districts, educating 75,000 students. That’s one entity for every 29 students. We’ve come a long way.

    Recent legislative attempts to improve the situation have only created more and overlapping organizations. These efforts have increased the inequalities among schools, added unnecessary complexity, made school governance and financing almost impossible for citizens to understand, and raised costs.

    It’s time to reduce our education entities to a reasonable number, based on where students live and where our schools are located. That will be a good first step in improving quality, ensuring equity, reducing costs, and enhancing community control.

    In reality, our children today are educated in about 50 K-12 school webs. By that we mean a set of sending elementary and middle schools and a high school. Regardless of administrative entities, what students experience is a 13 to 15 year educational journey from preschool through graduation. It’s the quality of this journey that matters.

    We’d solve many problems if we simply made each of these K-12 school webs into a school district. For 90% of our students, this would mean no change. For a few, especially those in very small high schools or with limited middle school opportunities, we’d want to combine with nearby schools to increase quality. Our school webs reflect organic patterns of population, economic activity, and community. Vermont has about 32 of these K-12 educational communities, some concentrated, some spread out; some with a few as 1000 students, some with as many as 4000, and averaging 2500 each.

    These should become our new educational entities, each with a board elected by the community, each running a complete set of public schools that guide students from Pre-K through high school graduation. That’s the way it’s done in most of the United States, and in most of the civilized world.

    Once our schools are rationally organized, we can work on the next steps of providing equal funding, and improving educational quality.

    Sources:

    Equity and History: Vermont’s Education Revolution of the Early 1890s, Vermont Historical Society, https://vermonthistory.org/journal/76/VHS760101_1-18.pdf

    Vermont School Webs, A Vermont Design for Education, https://vermontdesign.org/?page_id=26

  • The Academies

    In the days before Vermont provided public high schools, some of our communities set up “Academies” or “Seminaries” that educated students beyond the elementary grades. Often established by religious or charitable or philanthropic groups, the early 1800s witnessed academies  in Newbury, St. Johnsbury, Manchester, Fairfax, St. Albans. Thetford, McIndoes Falls, Corinth, Bradford, and elsewhere. They were governed by private boards of trustees, and students’ parents paid tuition to attend (for instance, $3 per term for a standard course; $3.50 with Greek and Latin). For decades these academies served as the sole source of high school education in many parts of Vermont. (In those days, few Vermonters went to high school, and even fewer completed it. Our graduation rate hovered at 5% at the end of the 19th century.)

    Most of the academies merged with the local public school system when the state required towns to provide high school education. Larger towns established their own public high schools; forward-looking smaller towns combined to build union high schools; and a few very small towns paid tuition for their students to attend a nearby high school.

    Four of the academies resisted the democratic trend and held on to their private status: Burr & Burton, St Johnsbury, Thetford, and Lyndon. Today these four private academies educate about 2% of our students. Burr & Burton and St. Johnsbury Academy are the two largest; Lyndon Institute and Thetford Academy the smaller. They are each governed by a self-perpetuating, unelected board of trustees; they own their land and buildings; their budgets and meetings are not open to the public. They are private schools.


    Vermont StudentsTuitionTotal
    Burr & Burton Academy687$23,346$16,038,702
    St. Johnsbury Academy639$23,425$14,968,575
    Lyndon Institute 374$24,100$9,013,400
    Thetford Academy312$25,060$7,818,720

    2012$23,777$47,839,397

    Yet Vermont relies on these academies to educate some of its students. Their communities depend on them for secondary education. At the same time, the academies depend on Vermont taxpayers  to cover their costs. It’s a co-dependent relationship: without the academies, 2000 of our students would have no place to go; without public money, the academies would cease operations. 

    Today the four academies are among the most expensive schools in the state. The academies receive over $50 million a year of Vermont taxpayers’ money in tuition and special education funds, forming 75% of their income. They charge tuition of $22,000 to $25,000 per student, far above the state average. Yet they are accountable neither to the local community nor to the state.

    And because we allow some of our towns to pay tuition to the academies, we must also allow them to pay tuition to any private school, anywhere in the world. This costs our taxpayers an additional $25 million per year, including over $1 million paid to religious schools.*

    Any education reform and funding plan needs to recognize Vermont’s co-dependent relationship with these academies, find a rational way to incorporate them into the public school system, and ensure that taxpayer money goes only to public schools.

    • These payments of taxpayer money to religious schools seem to conflict with Article 3 of the Vermont Constitution, which states that no person ought to, or of right can be compelled to… erect or support any place of worship, or maintain any minister, contrary to the dictates of conscience,
    https://larrycoffin.blogspot.com/2009/09/school-bells-academies-and-seminaries.html
    https://legislature.vermont.gov/Documents/2026/Workgroups/Senate%20Education/Introductions/Independent%20Schools/W~Oliver%20Olsen~Independent%20Schools%20in%20Vermont’s%20Education%20System~1-29-2025.pdf
  • How to lower costs

    We have good schools in Vermont, but they cost a lot. Our schools are close to their communities, they produce solid results, and they’re good places for our children to be. But they cost more per student than most other schools in the United States and in the world. 

    From the research posted here on A Vermont Design, we’ve learned that simply closing small schools, or consolidating districts, won’t save much money, and will produce unintended negative consequences. So what can we do to maintain the quality of our schools, but lower the costs?

    From examining school budgets across the state, and talking with many education professionals, we can identify three main drivers of increasing school costs: 

    ◦ expensive health insurance 

    ◦ over-identification of special education

    ◦ too many people in our schools.

    Health insurance

    Vermont schools pay more for the health insurance for their employees than almost anywhere else. Even in Massachusetts, which supports the most expensive medical care system in the world, the cost for a teacher’s health insurance plan is less than it is in Vermont. And consumes a far smaller proportion of their salary. Examining closely the budget of a typical Vermont elementary school, we see that health insurance costs amount to 47% of teacher salaries — $141,000 on top of salaries of $294,000. And it’s rising more than 10% per year. This is ludicrous and unprecedented and unsustainable.

    Why is this cost so high? Because the UVM Health Network has turned itself from a public care-giving organization into a private monopoly that sucks resources from citizens, school districts and taxpayers to support 100 staff making over a half million dollars each, with the head guy taking more than $3 million from us each year. This while the average Vermonter earns $60,000. Their $260 million in “surplus” (profit) would be enough to educate 12,000 students for a year. This is ridiculous, but not a laughing matter.

    The State has the power to control these obscene monopoly payments and profits, but has not done so.

    Special Education

    The same small school that spends $294,000 on teacher salaries for kindergarten through sixth grade spends $477,000 on special education services for these same students. That’s $5000 per student. Again, ludicrous. The cause of this is multifold, but far beyond the proportions of any other state or country. 

    Another larger district in a different part of the state spends $8 million of its $24 million budget on its 700 K-8 students, another $8 million on its 300 high school students, and the remaining $8 million on special education. A third of its budget. 

    Recent changes to the statewide funding scheme incentivize districts to over-identify students for special education. The state pays double for each student so identified. Lead us not into temptation…

    And again, the State has the power to manage these costs, but has not done so.

    Too Many People

    While it’s comforting to have many caring adults in a school, there’s a point of diminishing returns when the staff to student ratio falls below 1 to 6. And yet the budgets and staffing of our two typical districts show perhaps too many adults, professional and otherwise, working in the school and drawing a salary. In fact, Vermont’s staff to student ratio is the lowest among the states. The elementary school in our example, with fewer than 100 students, employs 31 staff: six classroom teachers, six aides, a full time principal, a full-time physical education teacher, half-time music and art teachers, and part-time nurse, librarian, counselor, support staff, custodians, cafeteria workers, and bus drivers.

    Walk through an elementary school parking lot and count the cars. Then divide the number of students in the school by the number of cars. Each car represents at least one adult, since we can assume than none of the students drove themselves to school. While some of the cars may belong to parent volunteers or delivery people, the bulk of them are likely to belong to school staff. This is one of Vermont’s cost drivers that local boards can partially control.

    Tuitions

    This is not as big a cost driver as the three listed above, but in both sample districts, tuition payments for high school form an overly large portion of the spending. In the larger district, one-third of the total budget is paid to private schools, at the rate of $24,000 per student, a total of $8 million for 320 students. This leaves the district with $8 million for its remaining 700 students in K-8, less than $12,000 each. 

    In the smaller district, more than $800,000 is paid in tuition to public and private high schools at $20,000 per student. Tuitions plus special education costs amount to almost half the budget, leaving less than $12,000 for each K-8 student.

    Conclusion

    To rein in rising costs at Vermont schools, we need to control monopoly pricing for health insurance; manage special education spending; and take a close, hard look, school by school, at the staff to student ratio.

    Sources: https://nces.ed.gov/programs/digest/d23/tables/dt23_213.50.asp

    https://gmcboard.vermont.gov/sites/gmcb/files/documents/2409-4606222_The_University_of_Vermont_Health_Network_Inc._and_Subsidiaries_24-23_vFINAL4_Unsecure.pdf
  • School Spending: Highs and Lows

    The amount we spend per student varies widely among Vermont schools, from a low of $12,000 at the Halifax Elementary school, to $30,000 at the Westminster Elementary School. At the high school level, spending ranges from $12,275 at Lamoille North to $27,412 at Randolph. (These data are sourced from the Announced Tuitions for 2026 published by the Vermont Agency of Education.) Per-student cost in elementary schools averages $19,436, and for high schools $21,560, an 11% difference.

    As we design a new governance and funding scheme, we need to look closely at the whys and wherefores of this wide range. Such a range certainly raises questions of educational equity and quality; it also raises questions of relative efficiency.

    High Schools

    What explains the wide range of spending in our high schools? School size seems not to be a factor. Some of our largest schools, such as St. Johnsbury Academy and Union-32, are among the most expensive; while some smaller schools, such as Winooski and Blue Mountain, cost the least. In fact, there is no significant correlation between high school size and per-student cost in Vermont.

    Ruralness may have some effect, but the opposite of what you might think. Some of our most rural high schools, such as Lamoille and Missisquoi, are the least costly. In fact, a very weak negative correlation of -0.18 exists between ruralness and cost. (Ruralness is estimated by the distance between K-12 sending and receiving schools.)

    Here is a table of high school costs, size, and distances to its sending schools.

    High School2026 CostStudentsDistance
    LAMOILLE NORTH UUSD (Morrisville)12,27550632
    WINOOSKI ID14,4002411
    OXBOW UNIFIED UNION SD (Bradford) 17,00035028
    BLUE MOUNTAIN USD 21 (Wells River)17,00021028
    MILTON ID17,7504512
    MONTPELIER ROXBURY SD18,50040832
    MT. ANTHONY UHSD 14 (Bennington)18,5001,03219
    FAIRFAX18,75091011
    SLATE VALLEY UUSD (Fair Haven)19,00056224
    MISSISQUOI VALLEY SD (Swanton)19,00076573
    BARRE UUSD19,0006465
    MT. MANSFIELD UUSD (Jericho)19,10077334
    WINDHAM SOUTHEAST UUSD (Brattleboro)19,50079734
    Twin Valley Unified SD (Wilmington)19,80020138
    White River Unified District (Royalton)19,900212114
    Quarry Valley Unified USD (Poultney)20,00037520
    BURLINGTON20,0001,02314
    CHAMPLAIN VALLEY USD #5620,2831,37821
    RIVENDELL INTERSTATE SCHOOL (Fairlee)20,5002123
    NORTH COUNTRY SR UHSD 2220,50069470
    MAPLE RUN USD (St. Albans)21,0009779
    STOWE21,0004522
    ELMORE MORRISTOWN USD21,0003085
    ARLINGTON21,0002001
    ESSEX WESTFORD ECUUSD21,0001,22222
    MT. ABRAHAM USD (Bristol)21,44163024
    MILL RIVER USD #5221,50038021
    SOUTH BURLINGTON21,7348934
    MT. ASCUTNEY SD (Windsor)21,87859913
    West River Union Education District21,97226937
    BURR AND BURTON ACADEMY21,97272755
    Green Mountain Unified SD22,00033939
    RUTLAND CITY22,0008209
    OTTER VALLEY USD #5322,15554826
    HARWOOD USD #60 (Mad River Valley)22,34057931
    Windsor Central Unified USD22,51048737
    SHARON ACADEMY THE22,900
    CRAFTSBURY23,00020027
    HARTFORD23,0005317
    HAZEN UHSD 26 (Hardwick)23,00031427
    COLCHESTER23,3007336
    LAKE REGION UHSD 24 (Barton)23,50038625
    BELLOWS FALLS UHSD 2723,50032718
    ADDISON CENTRAL USD #55 (Middlebury)23,52053132
    ADDISON NORTHWEST USD #54 (Vergennes)23,5454003
    ENOSBURG RICHFORD UUSD24,00054039
    CANAAN24,000
    ST JOHNSBURY ACADEMY24,60091234
    WASHINGTON CENTRAL UUSD (U-32)24,72876232
    DANVILLE25,00036233
    TWINFIELD USD 3325,00038733
    CABOT25,00017633
    THETFORD ACADEMY25,0603121
    LYNDON INSTITUTE25,20243235
    Paine Mountain SD (Northfield)26,00048534
    SPRINGFIELD26,4003713
    ORANGE SOUTHWEST UUSD (Randolph)27,4123737
    Mean21,56054025
    Median21,87848525
    Source: FY 2026 Announced Tuition Data Table, Vermont Agency of Education

    A complete understanding of the differences in costs among high schools would require a school-by-school analysis of budgets, staffing, and programming. Such an analysis should be part of any statewide school improvement plan.

    Elementary Schools

    Elementary school costs in Vermont range from $12,000 to $30,000 per student. Again, this wide range raises questions of equity, quality, and efficiency. What explains the wide range of spending? School size seems to be a minor factor. Some of our larger elementary schools, such as Charlotte and Newport City, are among the most expensive; while some smaller schools, such as Readsboro and Windham, cost the least. Yet there exists a weak correlation of -0.26 between elementary school size and per-student cost in Vermont. The largest third of our elementary schools cost on average $18,434 per student, while the medium-sized third cost $19,493, and the smallest third $20,339.

    Here is a table of elementary school cost and average size.

    DistrictCostStudents
    HALIFAX  12,000.00 77
    WAITS RIVER VALLEY USD 36  13,000.00 290
    WINOOSKI ID  13,900.00 476
    MT. MANSFIELD UUSD  14,082.00 407
    LAMOILLE NORTH UUSD  14,500.00 235
    FLETCHER  14,500.00 121
    OXBOW UNIFIED UNION SD  14,700.00 253
    GEORGIA  14,750.00 640
    STRAFFORD  14,928.00 129
    WINDHAM NORTHEAST UESD  15,000.00 197
    READSBORO  15,000.00 43
    BLUE MOUNTAIN USD 21  15,100.00 225
    MILTON ID  15,250.00 644
    DERBY  15,500.00 507
    STAMFORD  15,500.00 75
    FAIRFAX  15,950.00 624
    Green Mountain Unified SD  16,000.00 273
    CRAFTSBURY  16,000.00 222
    SOUTHWEST VT UESD  16,500.00 331
    CAMBRIDGE  16,936.00 345
    COLCHESTER  17,200.00 300
    MONTPELIER ROXBURY SD  17,500.00 454
    SLATE VALLEY UUSD  17,500.00 264
    Quary Valley Unified USD  17,500.00 294
    NORTHERN MOUNTAIN VALLEY UUSD  17,500.00 145
    THETFORD  17,500.00 210
    ORLEANS SOUTHWEST UESD  17,500.00 244
    Wells Spring Unified USD  17,500.00 
    ADDISON CENTRAL USD #55  17,530.00 400
    Twin Valley Unified SD  17,600.00 213
    NORWICH  17,668.00 353
    MISSISQUOI VALLEY SD  18,000.00 677
    BARRE UUSD  18,000.00 801
    MAPLE RUN USD  18,000.00 760
    STOWE  18,000.00 415
    ELMOREMORRISTOWN USD  18,000.00 344
    RUTLAND TOWN  18,000.00 378
    WINDHAM  18,200.00 22
    RUTLAND CITY  18,400.00 325
    MT. ANTHONY UHSD 14  18,500.00 331
    Paine Mountain SD  18,500.00 305
    Echo Valley Community SD  18,500.00 121
    ALBURGH  18,640.00 197
    Rochester Stockbridge Unified SD  18,687.00 97
    West River Union Education District  18,928.00 
    MARLBORO  18,928.00 92
    WINDHAM SOUTHEAST UUSD  19,000.00 278
    BURLINGTON  19,000.00 560
    ST. JOHNSBURY  19,000.00 722
    VERNON  19,000.00 189
    LudlowMt. Holly Unified USD  19,000.00 100
    CHAMPLAIN ISLANDS UUSD  19,093.00 141
    First Branch Unified SD  19,293.00 152
    RIVER VALLEYS UNIFIED SD  19,383.00 90
    Windsor Central Unified USD  19,680.00 285
    HARWOOD USD #60  19,743.00 300
    Taconic and Green Regional SD  19,800.00 308
    White River Unified District  19,900.00 171
    OTTER VALLEY USD #53  19,900.00 453
    ARLINGTON  20,000.00 
    MILL RIVER USD #52  20,000.00 150
    BRIGHTON  20,000.00 
    ADDISON NORTHWEST USD #54  20,450.00 300
    RIVENDELL INTERSTATE SCHOOL  20,500.00 122
    MT. ABRAHAM USD  20,542.00 420
    LINCOLN SD  20,542.00 70
    SOUTH BURLINGTON  20,739.00 443
    SOUTH HERO  20,895.00 141
    ESSEX WESTFORD ECUUSD  21,000.00 300
    ENOSBURGH RICHFORD UUSD  21,000.00 212
    TROY  21,000.00 193
    ORANGE SOUTHWEST UUSD  21,072.00 345
    CHAMPLAIN VALLEY USD #56  21,077.00 754
    SPRINGFIELD  21,300.00 290
    HARTFORD  21,500.00 257
    CANAAN  21,500.00 
    MT. ASCUTNEY SD  21,878.00 282
    WEATHERSFIELD  21,878.00 
    HARTLAND  21,878.00 282
    BARSTOW USD #49  21,950.00 199
    ROCKINGHAM  22,000.00 197
    SHARON  22,020.00 171
    WOLCOTT  22,500.00 121
    Kingdom East Unified USD  22,827.00 303
    DANVILLE  23,000.00 180
    LOWELL  23,000.00 86
    CHARLESTON  23,000.00 121
    JAY/WESTFIELD JOINT ELEM. DISTRICT  23,000.00 81
    ORLEANS CENTRAL UESD  23,000.00 175
    TWINFIELD USD 33  25,000.00 200
    CABOT  25,000.00 100
    Caledonia Cooperative Unified USD  25,000.00 148
    PEACHAM  25,000.00 66
    NEWPORT TOWN  25,000.00 135
    Mettawee School Distirct  25,300.00 140
    NEWPORT CITY  25,500.00 330
    WASHINGTON CENTRAL UUSD  25,626.00 203
    COVENTRY  29,000.00 127
    WESTMINSTER  30,000.00 187
         
    Mean  19,435.79   273.51 
    Median  19,000.00   235.00 
    Correlation     -0.26

    A complete understanding of the differences in costs among elementary schools would require a school-by-school analysis of budgets, staffing, and programming. Such an analysis should be part of any statewide school improvement plan.

  • Toward a Sustainable Education Fund

    Vermont’s first Education Fund was established in 1825 with money from the statewide wealth tax. The funds collected were distributed to the towns for the support of schools, and to pay for the new State Board of Education. The Fund has been in and out and up and down over the years, and remains with us as the source of support to our public schools. In recent years it has borne the brunt of much criticism and tinkering, and today stands at the center of the controversy surrounding the Governor’s education plan.

    Sources of support

    The Education Fund, which amounts to $2.3 billion in 2025, is fed by property taxes (65%), sales taxes (32%), and a few minor sources (3%). (The charts below show millions of dollars.)

    Expenditures

    The Education Fund pays for PreK-12 regular, special, and technical education, as well as for school meals, school transportation, and teachers’ retirement.

    Source: Education Fund Outlook for 2026

    The amount that each school district gets from the fund depends on a complex and shifting variety of factors including how many students it educates, of what types, and how much it votes to spend. As such it is unpredictable; the amount the fund needs to collect from taxpayers is not known until voters act in the spring, well after the state budget has been drafted.

    While the sales tax portion of the fund is collected by the state from hundreds of merchants, the property tax portion is paid to 251 town treasurers, who in effect send it to the state, which, after applying a complex formula that few understand, send it back out to 105 school districts and to low-income homeowners. This complexity has arisen in an attempt to equalize Vermont’s distribution of real property wealth, which ranges from $25 million per student in Stratton to $0.5 million in Fair Haven.

    Vermont’s education fund today is hardly understandable, often unpredictable, seldom sufficient, and therefore unsustainable. We might do better if we simplify it, strengthen it, and insulate it from the political whims of the moment.

    • First, let’s simplify it by letting the state collect the real property tax directly from owners, the same school tax rate no matter where you live.
    • Second, let’s expand the definition of property to include the financial assets of wealthy citizens not currently taxed. See Vermont’s Wealth Tax: A Brief History, and WOOFs.
    • Third, let’s allocate the money directly to the K-12 school districts based on the number of students, with slight adjustments for special circumstances. In this way, each student benefits from equal resources regardless of zip code.

    Give this fund a year or two to build up a reserve, then move to a forward-funding model in which schools know a year in advance what their allocation will be, so they can build an expenditure budget accordingly. Along the way, set aside a school construction portion to support capital projects requested by the schools.

    The per-student allocation would be set each year by the Legislature, based on the education price indexes compiled by the Bureau of Labor Statistics. The General Assembly would then set the statewide property tax rates. The latter would be adjusted annually to fulfill the needs of the former.

    Such a fund would be easier to understand, easier to administer, more stable, and less subject to partisan politics. And thus sustainable.

    Lower Property Tax

    In addition, moving to a sustainable Education Fund would lower the property tax for most Vermonters. Currently, Vermonters own about $200 billion worth of wealth: $100 billion in real property that you can walk on, see, and touch; another $100 billion in financial assets, such as stocks and bonds, trust funds, and business equity. The former contributes to the education fund, the latter does not. To raise the $1.5 billion now sent to the Fund by property taxes, we could lower the tax rate to 0.75%, half of the current rate. See Education Fund Outlook, and Net Worth Held by Households

  • Vermont’s School Webs: An Analysis

    Our map and table of how Vermont students actually follow their educational paths from kindergarten through grade 12 is now complete. They show that our schools have organized themselves into 50 K-12 clusters, or webs, of elementary, middle and high schools, based on geography and community settlement patterns. (But not always along town or county lines.)

    40 of the webs are neat, well-defined, self-contained, of reasonable size, and don’t overlap. They consist of several elementary schools that send their students on to a single middle or high school. They range in size from 1000 to 4000 students, most around 2000. They include the vast majority of our 82,000 students. They seem to work well.

    The other ten webs display inconsistent sending and receiving patterns; or very small high schools, often close to one another; or overlapping or duplicative governance schemes. (Some webs with fewer than 1000 students, for example, elect five separate school boards with overlapping responsibilities and administrative duplication.) These ten webs represent a very small slice of Vermont’s student population.

    We might begin our design of an improved governance scheme first by considering each of the 40 well-defined K-12 webs as a school district. Some of these, small and adjacent, may well choose to combine administrative offices for convenience and efficiency.

    Second we’d work with the remaining ten to see how each one might be improved, perhaps by joining with a neighbor, or combining their nearby small high schools. In this way we might end up with perhaps 30 K-12 districts, while causing little disruption among the majority of webs that make sense and have worked well.

    To govern the district, each of the communities surrounding an elementary school would elect a school board. These community boards would combine to form the middle-high school board. In this way a solid K-12 program could be built, while at the same time preserving community participation at the school level. The board would hire a superintendent, allocate the budget, and set policies for the schools.

    Such an approach would cut in half the number of administrative units, while preserving local democratic control and involvement. It would encourage cooperation among communities. It would focus school boards and superintendents on educational matters rather than tax rates. See Toward a Sustainable Education Fund.

    Would this save money?

    Reorganizing governance along these organic lines would cut the number of administrative units at least in half, which would save money now spent on non-educational matters. Combined with the sustainable education fund at the state level, these organic districts would help focus the efforts of school boards and leaders on teaching and learning.

    (However, this approach alone would not alter major drivers of our recent school cost increases: health insurance and special education. These two need a separate analysis.)